Searching for the best technical indicators for forecasting trends in the stock exchange? Well, along with studying candlesticks patterns, technical traders should also make use of other indicators like Moving-Averages, Relative Strength Index (RSI), Fibonacci Series, etc which can assist in ensuring an emerging trend while trading.
There are lots of widely used technical tools all functions completely different from one another yet all supporting in confirmation of the forecasted trends.

A moving average is one of the single most widely used technical indicators used by traders. Using one or many moving averages is dependent on the trading strategy of the technical trader. The moving average can be very useful in forecasting both long-term and short-term market trends.
What is Moving Average Technical Tool?
The moving average technical analysis tool helps in smoothing out data by producing a persistently updated average price. The average can be any specific time period trader chooses like 7 days, 10 minutes, or 20 weeks, etc.
The best thing about Moving-Average is that it can calculate any period of time as you can tailor it to any time frame. For instance, if you have 30 yrs sales data, you can calculate a 5-year moving average, a 4-years moving average, and so on.
How to Use Moving Average Technical Indicator in Trading?
An easy moving average trading strategy could be like buying security as long as the exponential average price of 50-period is up and sell as long as the exponential average price of 50-period is down.
Another most widely employed indicator is the Moving Avg. Crossovers. The crossover trading strategy is to buy when the 10-period moving average crossover 50-period average.
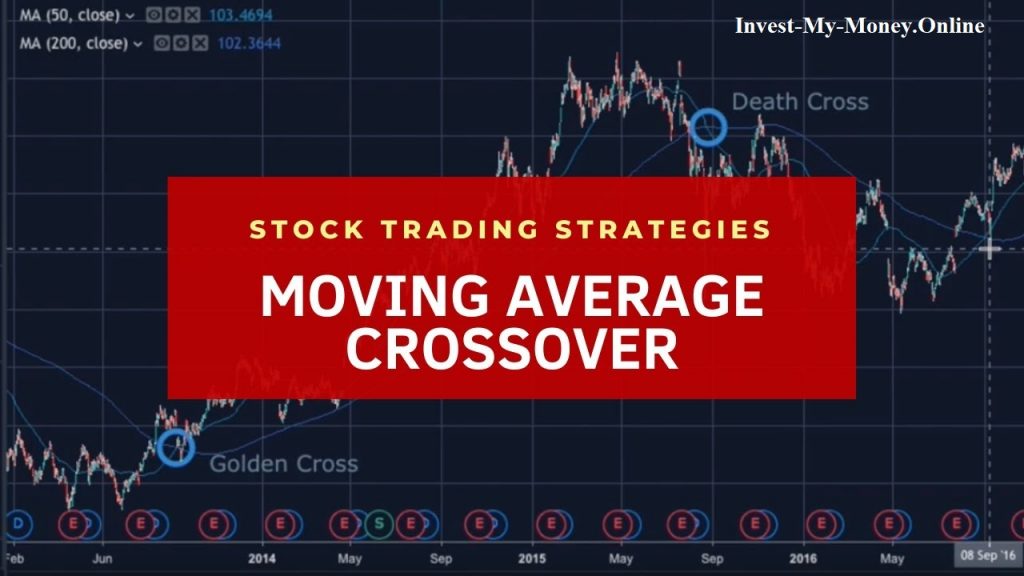

The high the moving average is, the high the price movement of a security is to be predicted. For instance, a price range crossing higher or lower of 100 or 200 periods is considered more significant than a price range crossing higher or lower of or 10 periods.
Note: Do not use Moving Average as a sole influencer in making trading decisions for you. Use multiple technical analysis tools like Relative Strength Index (RSI), Bollinger Bands, Candlestick patterns along Moving Average to support your buying or selling decisions.
Table of Contents